Overview of the Mark to Market Process in Levridge
| Updated: Feb 28, 2023 | Accounting | read
 read
readThis blog will give a high-level detail of the Mark to Market process for Levridge. It won’t go into the details of the setup needed but will show the process from start to finish.
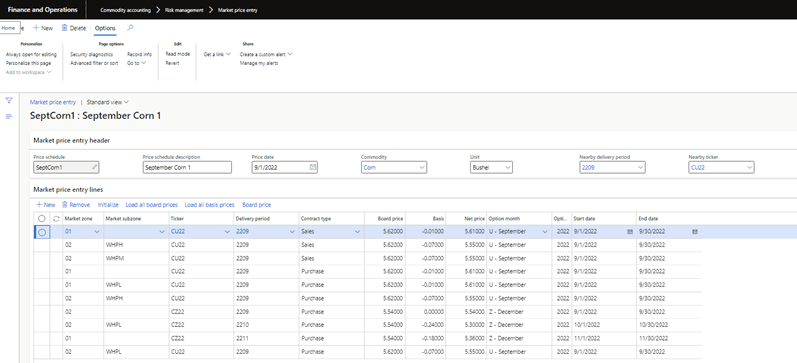
The first part of the process is to create the Market Price Entry. These will be the lines that will determine the market board and basis prices to be used in the mark to market calculations. When creating the new market price entry you can give it a unique schedule ID along with a description. The price date will be used to pull the data as of that date. This will give you a vision of what the contracts looked like as of the price date. The Nearby delivery period and Nearby ticker are used for any of the delinquent purchase and sales contracts. The example below has a price date of September 2022. This means any delinquent contracts will use the nearby price entry lines when calculating the mark to market. A delinquent contract will be any contract that has a delivery period and/or ticker that are before the nearby values.
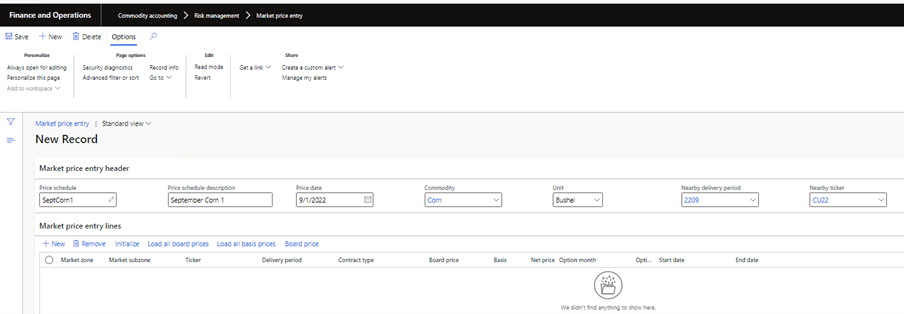
Once the header values have been populated you can start to build the lines. You can add and remove the rows manually using the New and Remove buttons. Another option is to click Initialize which will delete any current records and build them using a process that compares all open contracts and creates unique records for Market zone, Market subzone, Ticker, Delivery period, and Contract type. It will also create a record for the Nearby delivery period and Nearby ticker for Purchase and Sales contract type. The Sales contract nearby records will be used when calculating the inventory market value.
After the records have been initialized you can either manually update the board and basis prices or load them automatically. For board price this is done by clicking Load all board prices. This will use the ticker and commodity and populate the effective board price. Same is true for the basis price. This will use the basis configuration to load the basis price using the commodity, delivery period, and ticker. After the board and basis prices are loaded you are still able to modify the values on the market price entry. This completes the Market price entry setup.
The next process of Mark to Market is to run the calculations for the created market price entry. On the Mark to Market Summary you select the Commodity and Price schedule you want to use for the calculations. There is also an option to run the mark to market for a group of commodities that will be explained later. Once the selections have been made you click the Calculate button. This will load all of the mark to market data for the selected market price entry.
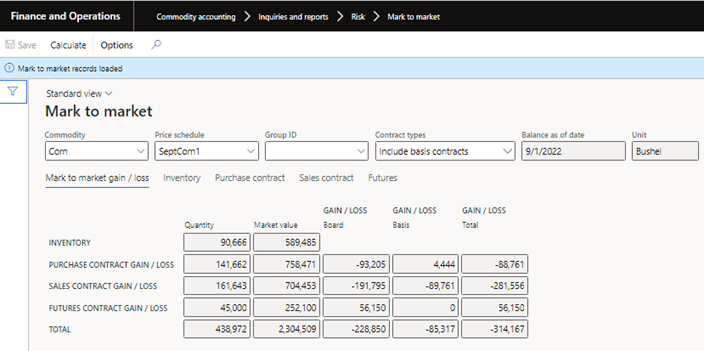
There is a Contract types selection field that can filter the mark to market data to include basis contracts, exclude basis contracts, or show only the basis contracts. The Mark to market gain/loss tab shows the summary of quantity, market value, and gain/loss amounts for inventory, purchase contracts, sales contracts, and futures contracts. At the bottom it has an overall total.
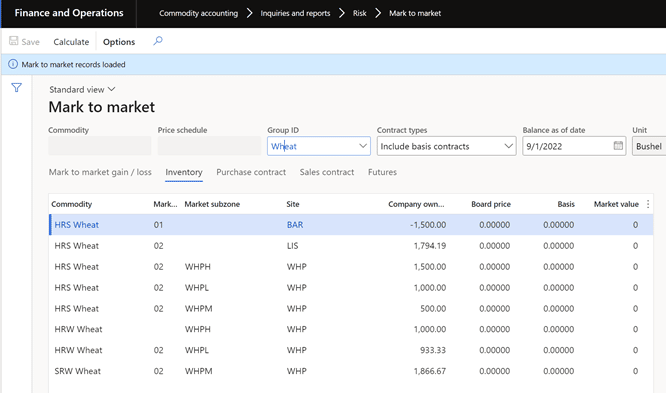
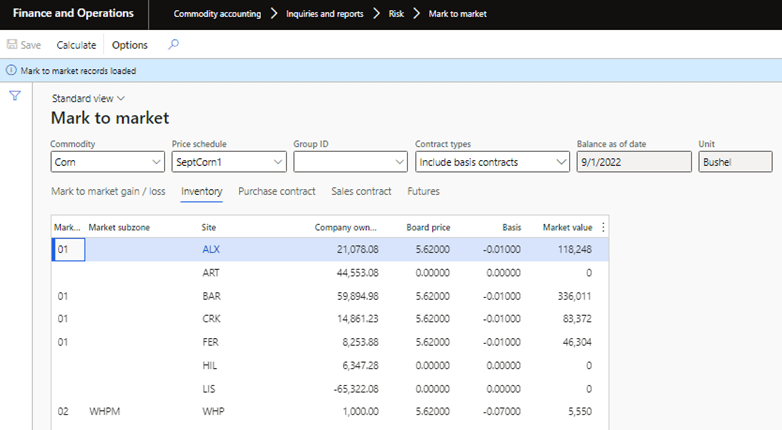
The Inventory tab will show the Company owned inventory numbers split out by Market zone, Market subzone, and Site. The board and basis prices come from the market price entry nearby lines for Sales contract type. In the example below there are some sites that do not have board and basis price. In those scenarios you would have to go back to the Market price entry and create these nearby lines to get market board and basis prices.
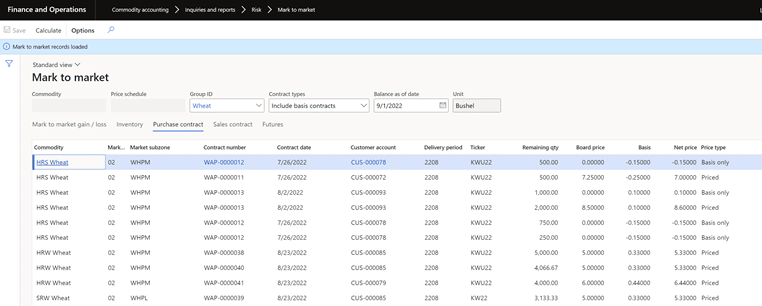
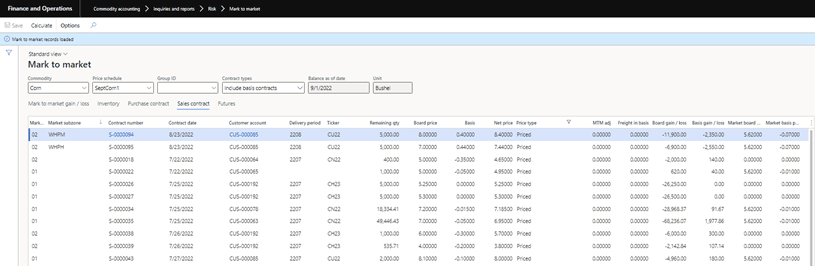
The next tab is Purchase contracts which shows the contract details that make up the mark to market purchase contract numbers. This will lay out the contracts board and basis price, the mark to market board and basis price, and the gain/loss amounts for board and basis.
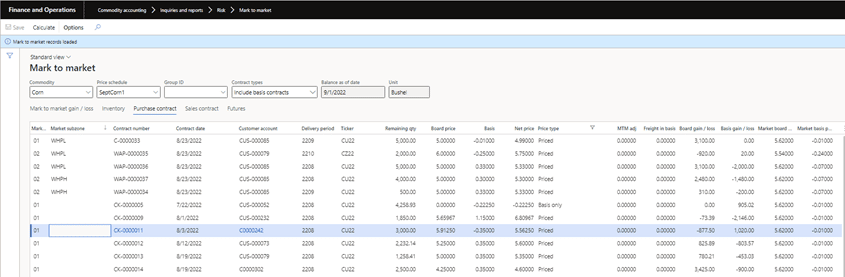
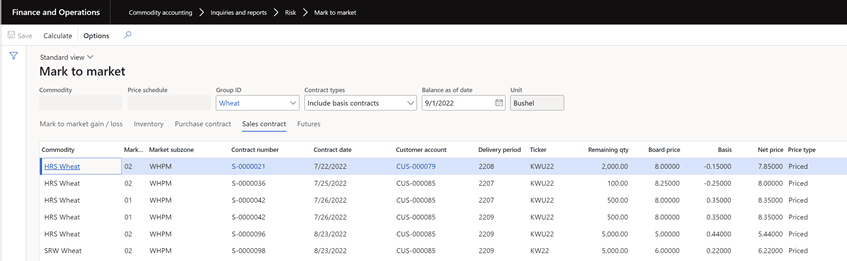
The Sales contract tab is the same as the purchase except it is for the sales contracts that make up the mark to market summary.
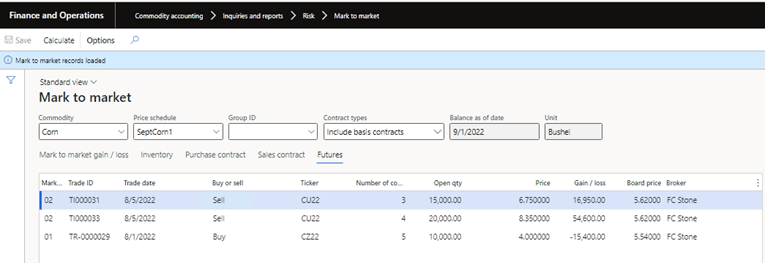
The last tab is for Futures contracts. This tab will show all the details of the future trades that includes the price, market price, and gain/loss amount.
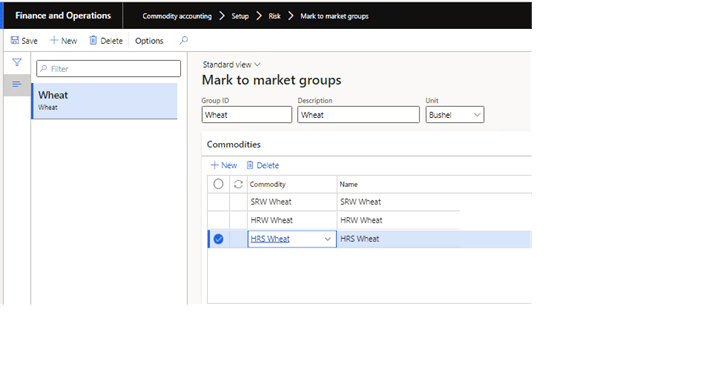
The last part of this overview of the Mark to Market is showing how to run it for a group that has been setup. Example you want to see the Mark to Market summary for hard red winter wheat, hard red spring wheat, and soft red winter wheat. There is a setup form that will create this group. On the group you need to list the Unit that will be used when running the mark to market. You will not be able to add a commodity to the group that is not setup with a unit of measure conversion to the unit defined on the group.
When you select a Group ID to be used on the mark to market it will use each commodities’ price schedule for the balance as of date when calculating the mark to market values. In short this rolls up all of the mark to market for individual commodities into one mark to market summary.
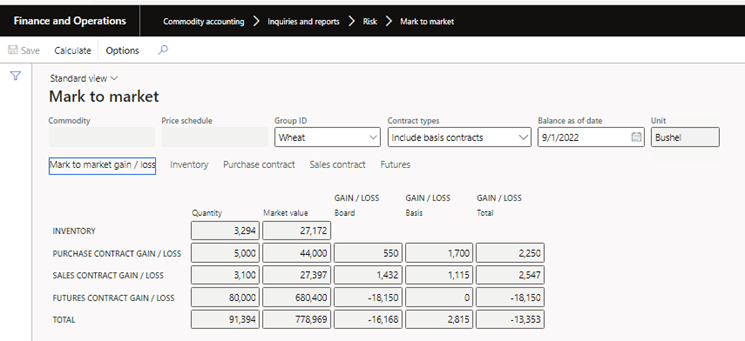
The summary will include all commodities in the group and all other tabs will show the mark to market details for those commodities.